Funatic Maths

Statistics

  • Written on
    - Paper 2

    Question 1

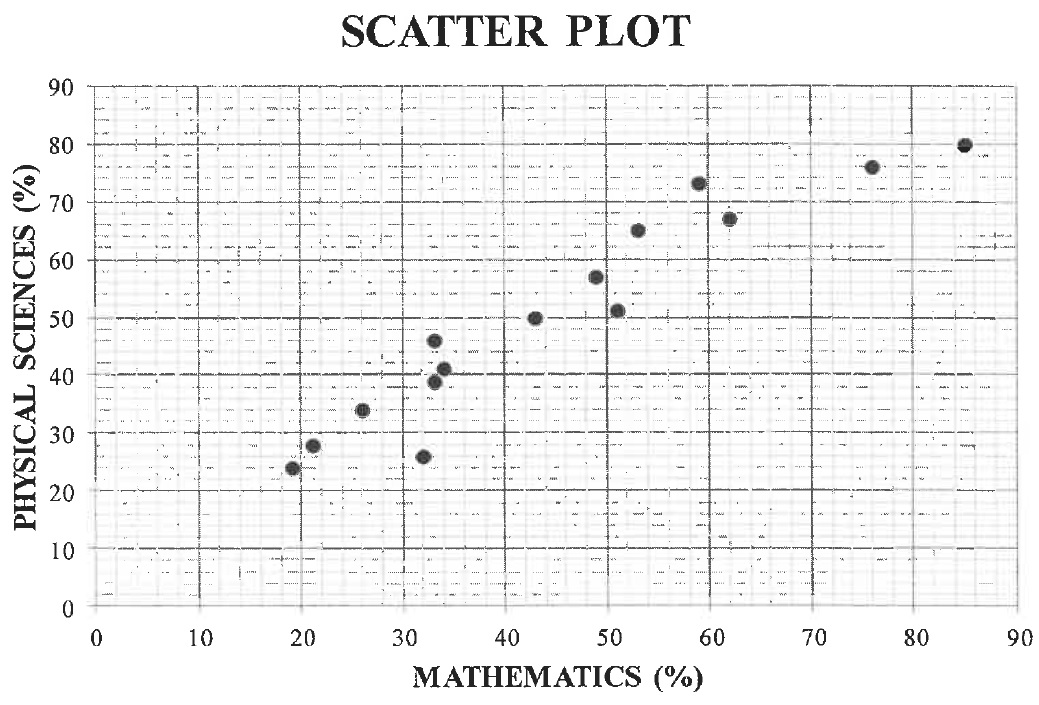
    A Mathematics teacher was curious to establish if her learners' Mathematics marks influenced their Physical Sciences marks. In the table below, the Mathematics and Physical Sciences marks of 1515 learners in her class are given as percentages (%)(\%).
     \:MATHEMATICS (AS %\%) 2626 6262 2121 3333 5353 7676 3232 59  59\:\:
      43\:\:43 3333 4949 5151 1919 3434 8585
     \:PHYSICAL SCIENCES (AS %\%) 3434 6767 2828 4646 6565 7676 2626 73  73\:\:
      50\:\:50 3939 5757 5151 2424 4141 8080
    Image
    1.11.1 Determine the equation of the least squares regression line for the data. (3)(3)
    1.21.2 Draw the least squares regression line on the scatter plot provided in the ANSWER BOOK. (2)(2)
    1.31.3 Predict the Physical Sciences mark of a learner who achieved 69%69\% for Mathematics. (2)(2)
    1.41.4 Write down the correlation coefficient between the Mathematics and Physical Sciences marks for the data. (1)(1)
    1.51.5 Comment on the strength of the correlation between the Mathematics and Physical Sciences marks for the data. (1)(1)
    1.61.6 What trend did the teacher observe between the results of the two subjects? (1)(1)
    [10]\textbf{[10]}
  • Written on
    - Paper 2

    Question 1

    The table below shows the monthly income (in rands) of 66 different people and the amount (in rands) that each person spends on the monthly repayment of a motor vehicle.
    \quadMONTHLY INCOME (IN RANDS) 9 0009\,000 13 50013\,500 15 00015\,000 16 50016\,500 17 00017\,000 20 00020\,000
    \quadMONTHLY REPAYMENT (IN RANDS) 2 0002\,000 3 0003\,000 3 5003\,500 5 2005\,200 5 5005\,500 6 0006\,000
    1.11.1 Determine the equation of the least squares regression line for the data. (3)(3)
    1.21.2 If a person earns R14 000R14\,000 per month, predict the monthly repayment that the person could make towards a motor vehicle. (2)(2)
    1.31.3 Determine the correlation coefficient between the monthly income and the monthly repayment of a motor vehicle. (1)(1)
    1.41.4 A person who earns R18 000R18\,000 per month has to decide whether to spend R9 000R9\,000 as a monthly repayment of a motor vehicle, or not. If the above information is a true representation of the population data, which of the following would the person most likely decide on:
    A\quad A Spend R9 000R9\,000 per month because there is a very strong positive correlation between the amount earned and the monthly repayment.
    B\quad B NOT to spend R9 000R9\,000 per month because there is a very weak positive correlation between the amount earned and the monthly repayment.
    C\quad C Spend R9 000R9\,000 per month because the point (18 000  ; 9 000)(18\,000\;;\,9\,000) lies very near to the least squares regression line.
    D\quad D NOT to spend R9 000R9\,000 per month because the point (18 000  ; 9 000)(18\,000\;;\,9\,000) lies very far from the least squares regression line. (2)(2)
    [8]\textbf{[8]}
  • Written on
    - Paper 2

    Question 2

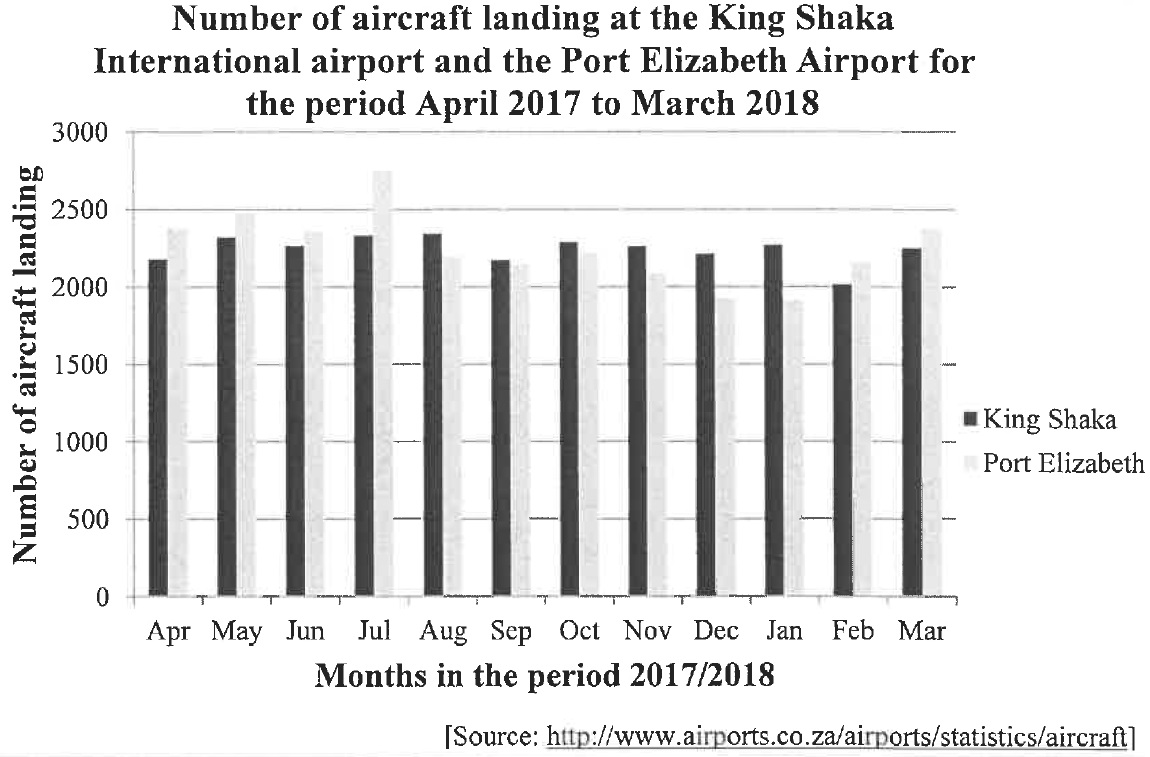
    The number of aircraft landing at the King Shaka International Airport and the Port Elizabeth Airport for the period starting in April 20172017 and ending in March 20182018, is shown in the double bar graph below.
    Image
    2.12.1 The number of aircraft landing at the Port Elizabeth Airport exceeds the number of aircraft landing at the King Shaka International Airport during some months of the given period. During which month is this difference the greatest? (1)(1)
    2.22.2 The number of aircraft landing at the King Shaka International Airport during these months are:
      2 182\:\:2\,182 2 3232\,323 2 2672\,267 2 3342\,334 2 3462\,346 2 1752\,175
      2 293\:\:2\,293 2 2632\,263 2 2152\,215 2 2712\,271 2 0182\,018 2 2542\,254
    Calculate the mean for the data. (2)(2)
    2.32.3 Calculate the standard deviation for the number of aircraft landing at the King Shaka International Airport for the given period. (2)(2)
    2.42.4 Determine the number of months in which the number of aircraft landing at the King Shaka International Airport were within one standard deviation of the mean. (3)(3)
    2.52.5 Which ONE of the following statements is CORRECT?
    A.\quad A. During December and January, there were more landings at the Port Elizabeth Airport than at the King Shaka International Airport.
    B.\quad B. There was a greater variation in the number of aircraft landing at the King Shaka International Airport than at the Port Elizabeth Airport for the given period.
    C.\quad C. The standard deviation of the number of landings at the Port Elizabeth Airport will be higher than the standard deviation of the number of landings at the King Shaka International Airport. (1)(1)
    [9]\textbf{[9]}
  • Written on
    - Paper 2

    Question 2

    A survey was conducted among 100100 people about the amount that they paid on a monthly basis for their cellphone contracts. The person carrying out the survey calculated the estimated mean to be R 309R\,309 per month. Unfortunately, he lost some of the data thereafter. The partial results of the survey are shown in the frequency table below:
    \quadAMOUNT PAID (in Rands) \quadFREQUENCY
    0<x≤100\quad 0<x \leq 100 7\quad 7
    100<x≤200\quad 100<x \leq 200 12\quad 12
    200<x≤300\quad 200<x \leq 300 a\quad a
    300<x≤400\quad 300<x \leq 400 35\quad 35
    400<x≤500\quad 400<x \leq 500 b\quad b
    500<x≤600\quad 500<x \leq 600 6\quad 6
    2.12.1 How many people paid R 200R\,200 or less on their monthly cellphone contracts? (1)(1)
    2.22.2 Use the information above to show that a=24a=24 and b=16b=16. (5)(5)
    2.32.3 Write down the modal class for the data. (1)(1)
    2.42.4 On the grid provided in the ANSWER BOOK, draw and ogive (cumulative frequency graph) to represent the data. (4)(4)
    2.52.5 Determine how many people paid more than R 420R\,420 per month for their cellphone contracts. (2)(2)
    [13]\textbf{[13]}